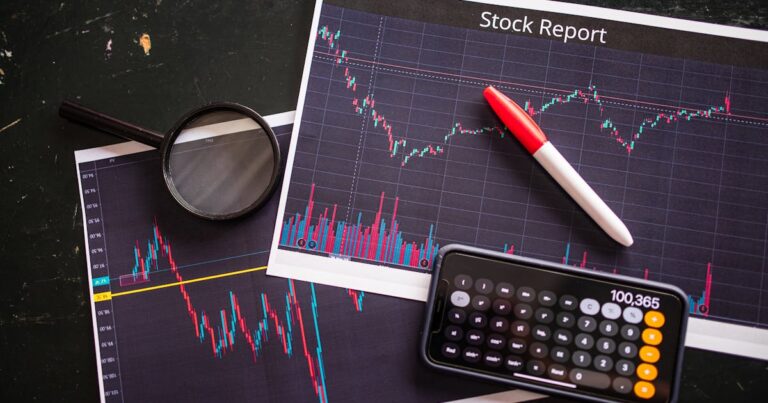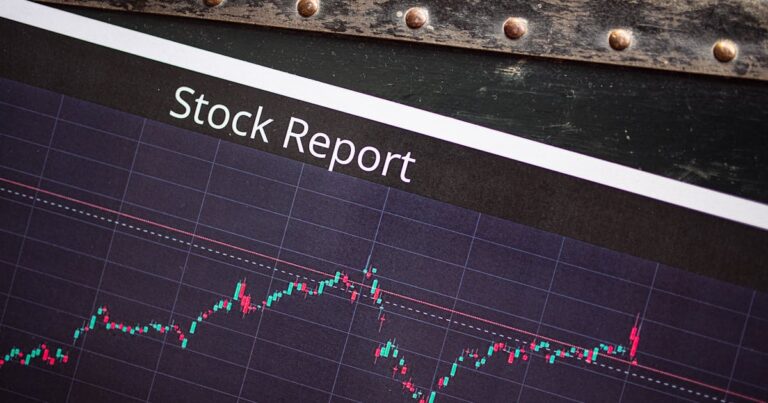
The S&P 500 Just Posted Its 4th Straight Losing Week. The Russell 2000 Is Already in Correction.
The S&P 500 just closed its 4th straight losing week — the longest weekly losing streak of 2026. The Russell 2000 officially entered correction territory on Friday, becoming the first major U.S. index to fall more than 10% from its recent high. The Nasdaq and Dow touched correction intraday but closed just above the threshold. Here is what happened, why small caps broke first, and what comes next.
The Numbers This Week
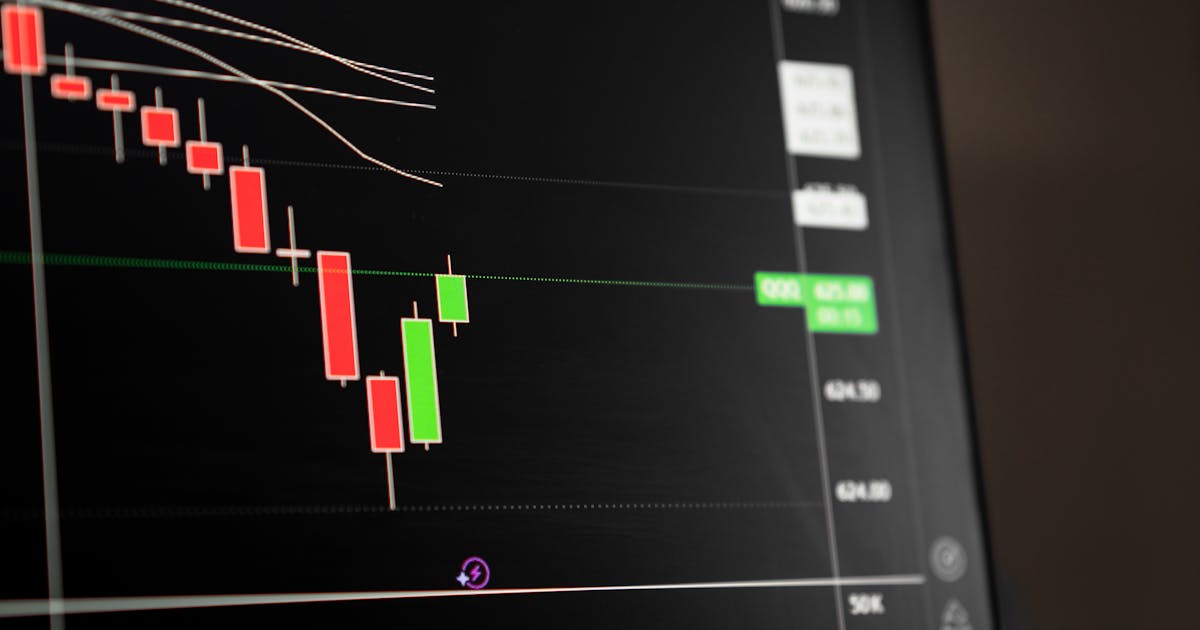
- S&P 500: -1.50% Friday, closed at 6,507. Down 7% from its recent high. 4th consecutive losing week.
- Nasdaq: -1.98% Friday, closed at 21,654. Touched correction territory intraday, closed just above -10%.
- Dow: -0.96% Friday, closed at 45,577. Same story as Nasdaq — intraday correction, avoided close below threshold.
- Russell 2000: -10.9% from its all-time high. Officially in correction. Down 7% in March alone.
- Brent crude: $102.83 — up more than 50% since the Iran war started.
- Bitcoin: $70,321, +2.29% — holding up better than equities.
Why Small Caps Broke First
The Russell 2000 is not a random leading indicator. Small-cap companies are more sensitive to the domestic economic cycle than mega-caps for 3 specific reasons.
First, small caps borrow more. They carry higher debt loads relative to their size and are more exposed to floating-rate loans. When the Fed signals no cuts, refinancing costs stay elevated and margins compress faster than at large caps with locked-in fixed-rate debt.
Second, small caps have less pricing power. When energy costs rise, a company like ExxonMobil benefits. A small regional manufacturer that uses energy as an input does not. With oil up 50%+ since early March, operating costs across the Russell 2000 are rising and few of those companies can pass the full increase on to customers.
Third, small caps have more domestic revenue exposure. They cannot hedge geopolitical risk by diversifying revenue globally. What happens in the US economy is what happens to their bottom line.
“It usually is the smaller companies that take the beating first,” said Sam Stovall, chief investment strategist at CFRA Research. “Questions over a softening in economic growth, stagflation, or even a recession are more apt to adversely affect small caps than large caps.”
What Is Driving the Selloff
Three forces are compressing markets simultaneously.
Energy inflation is no longer a risk — it is a reality. Brent at $102 feeds directly into PPI, then CPI, then earnings. The Iran war lit a fire under oil in early March. The strike on Qatar’s Ras Laffan LNG plant last week made it structural. The market is now pricing an energy shock that does not resolve quickly.
The Fed is out of the picture. Powell’s press conference Wednesday made clear that rate cuts are off the table until inflation data improves. With PPI running hot and energy prices rising, that improvement is not coming soon. The June cut is gone. Markets now price only 1 cut — in December. Higher for longer, on top of an energy shock, is a difficult environment for growth stocks.
Record options expiration amplified Friday’s moves. Quad witching — the simultaneous expiration of stock options, stock index options, stock index futures, and single-stock futures — happened Friday. It always increases volatility. In a market already under pressure, it made the selling sharper and the intraday swings wider than the underlying news justified.
Morgan Stanley’s Warning
The headline index numbers do not tell the full story. Morgan Stanley’s Mike Wilson, who correctly called the early 2026 correction, noted last week that more than 40% of S&P 500 members are already down 20% or more from their 52-week highs. The index itself is only down 7% because a handful of mega-caps — Apple, Microsoft, Nvidia, Amazon, Meta — are holding the average up. Strip those out and the average stock is already in bear market territory.
Nike closed near a 52-week low of $52 on Friday. Home Depot is near its 52-week low. O’Reilly Automotive is near its 52-week low. Consumer discretionary is getting hit. The breadth of the selloff is wider than the headline number suggests.
What To Watch Next Week
- Will the Nasdaq and Dow officially close in correction? Both touched -10% intraday Friday. One more bad day closes that gap. Watch Monday’s open.
- Iran ceasefire signals. Any credible de-escalation removes the primary driver of the selloff. Oil drops, yields ease, the Fed gets room to cut. Without it, the pressure continues.
- S&P 500 at 6,200. That is roughly the -10% correction threshold from the recent high. It is 5% below Friday’s close. Watch how the market behaves as that level approaches.
- Yield on the 10-year. If yields rise further as inflation expectations get re-anchored higher, the pressure on growth stocks intensifies. If yields start to fall on recession fears, defensive rotation accelerates.
The Russell 2000 has historically been a leading indicator for the broader market by 2 to 4 weeks. It broke first in 2020. It broke first in 2022. It is breaking first again now.